
TLDR
If you’re running Docker on a homelab box, a NAS, or a Raspberry Pi, you’ve probably wished you could see what’s running without opening a browser tab and logging into something. The Docker Monitor Stream Deck plugin puts that live dashboard, and a lot more, right on your physical deck.
See more here: Docker Monitor on Elgato Marketplace.
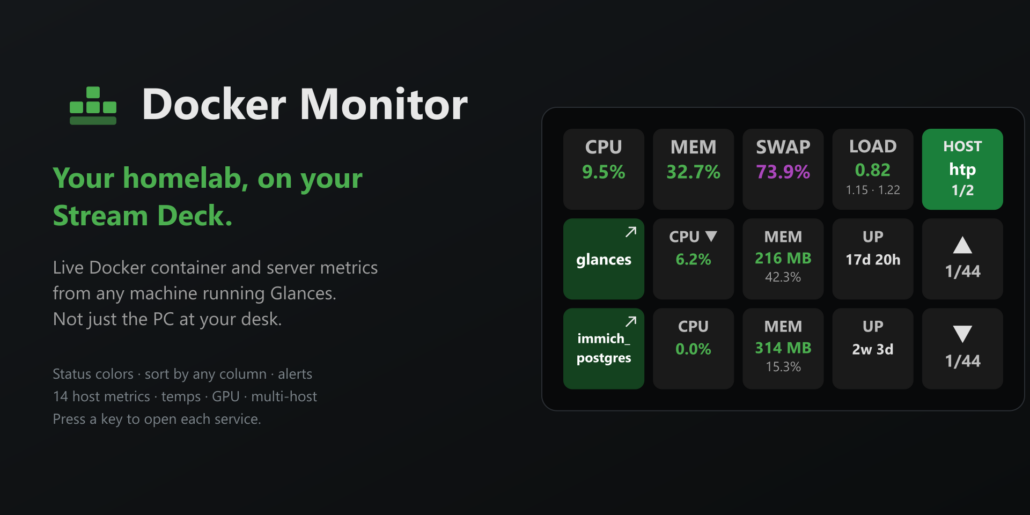
What It Does
The plugin offers five actions:
- Container Metrics – one key per column, showing a container’s Name, CPU, Memory, Uptime, Status, Disk I/O, Network or Image. Keys pick up their list row from where they sit on the deck, so a row of keys is a row of the list
- Scroll Container List – page up and down through every container, on keys or on a Stream Deck Plus dial
- Host Metrics – fourteen pages of server stats: CPU, memory, swap, load, network, disk I/O, disk usage, temperature, GPU, host uptime, process count, top process, IP address and fan speed. Pin one per key or cycle through several
- Switch Host – monitor any number of Glances servers and press to cycle between them, with a green or red background showing whether the active host is answering
- Install/Open Profile – jump to the bundled 15-key profile, which lays out a host metrics row and two container rows for you
Container names sit on a background colored by status: green for running or healthy, orange for paused, restarting or starting, dark orange for a container that’s up but failing its health check, and red for stopped. Metric values follow Glances’ own threshold colors, so a CPU number turns blue at 50%, purple at 70% and red at 90% without you configuring anything.
Powered by Glances
The plugin doesn’t talk to the Docker socket directly. It talks to , the open source monitoring agent, over its REST API. That’s what makes it useful for a homelab rather than just the machine on your desk: point it at any Linux, macOS or Windows box on your network and you get that machine’s containers and that machine’s health, not the PC the Stream Deck is plugged into.
Getting Glances running relatively straighforward. Find details at the Glances github.
Open http://your-server:61208 in a browser to confirm it’s up. The read-only Docker socket mount is what lets Glances report container stats; pid: host lets it see host processes and load. If you’d rather not use Docker, pip install "glances[web]" and glances -w does the same thing. Authentication is optional HTTP Basic.
Sorting, Scrolling and Alerts Only
The list defaults to highest CPU on top and updates live. Press any metric key to re-sort by that column and press it again to flip the direction, so the CPU key is both a readout and a control. Status sorts problem containers to the top, Disk I/O and Network sort by throughput, and Image sorts alphabetically.
For anything longer than the rows you have, Auto Scroll pages through the whole list on an interval and pauses when you scroll by hand. Alerts Only takes the opposite approach: it hides the healthy, quiet containers entirely and lists only the ones that are down, failing a health check, or over your CPU and memory thresholds. On a good day the deck is empty, which is exactly the point.
Opening a Container
Pressing a container’s Name key opens its web page in a browser. Glances doesn’t report port mappings, so the plugin works through a chain: a per-container URL override you set, then a URL template such as https://{name}.example.lan, then the container’s first published port, then the Glances web UI as a fallback. A small arrow on the key shows when a real destination is known, and setting an override to none disables the link for containers that have nothing worth opening.
Setup
- Install the plugin from the Elgato Marketplace
- Press the Install/Open Profile key, or drag Container Metrics keys onto a row and pick each key’s column
- Open any key’s settings, add your Glances host’s address and port (61208 by default), and press Test Connection
- The list fills in and starts updating
Notes
Every key on the deck reads from a single shared poll cycle rather than polling on its own, so a deck covered in container and host keys puts no more load on your Glances server than a single key does. The plugin also writes rotating logs to its logs/ folder, including a periodic health heartbeat, which makes after-the-fact diagnosis possible if something ever goes quiet.
Docker Monitor is an independent plugin and is not affiliated with or endorsed by Glances, Docker or Elgato.
